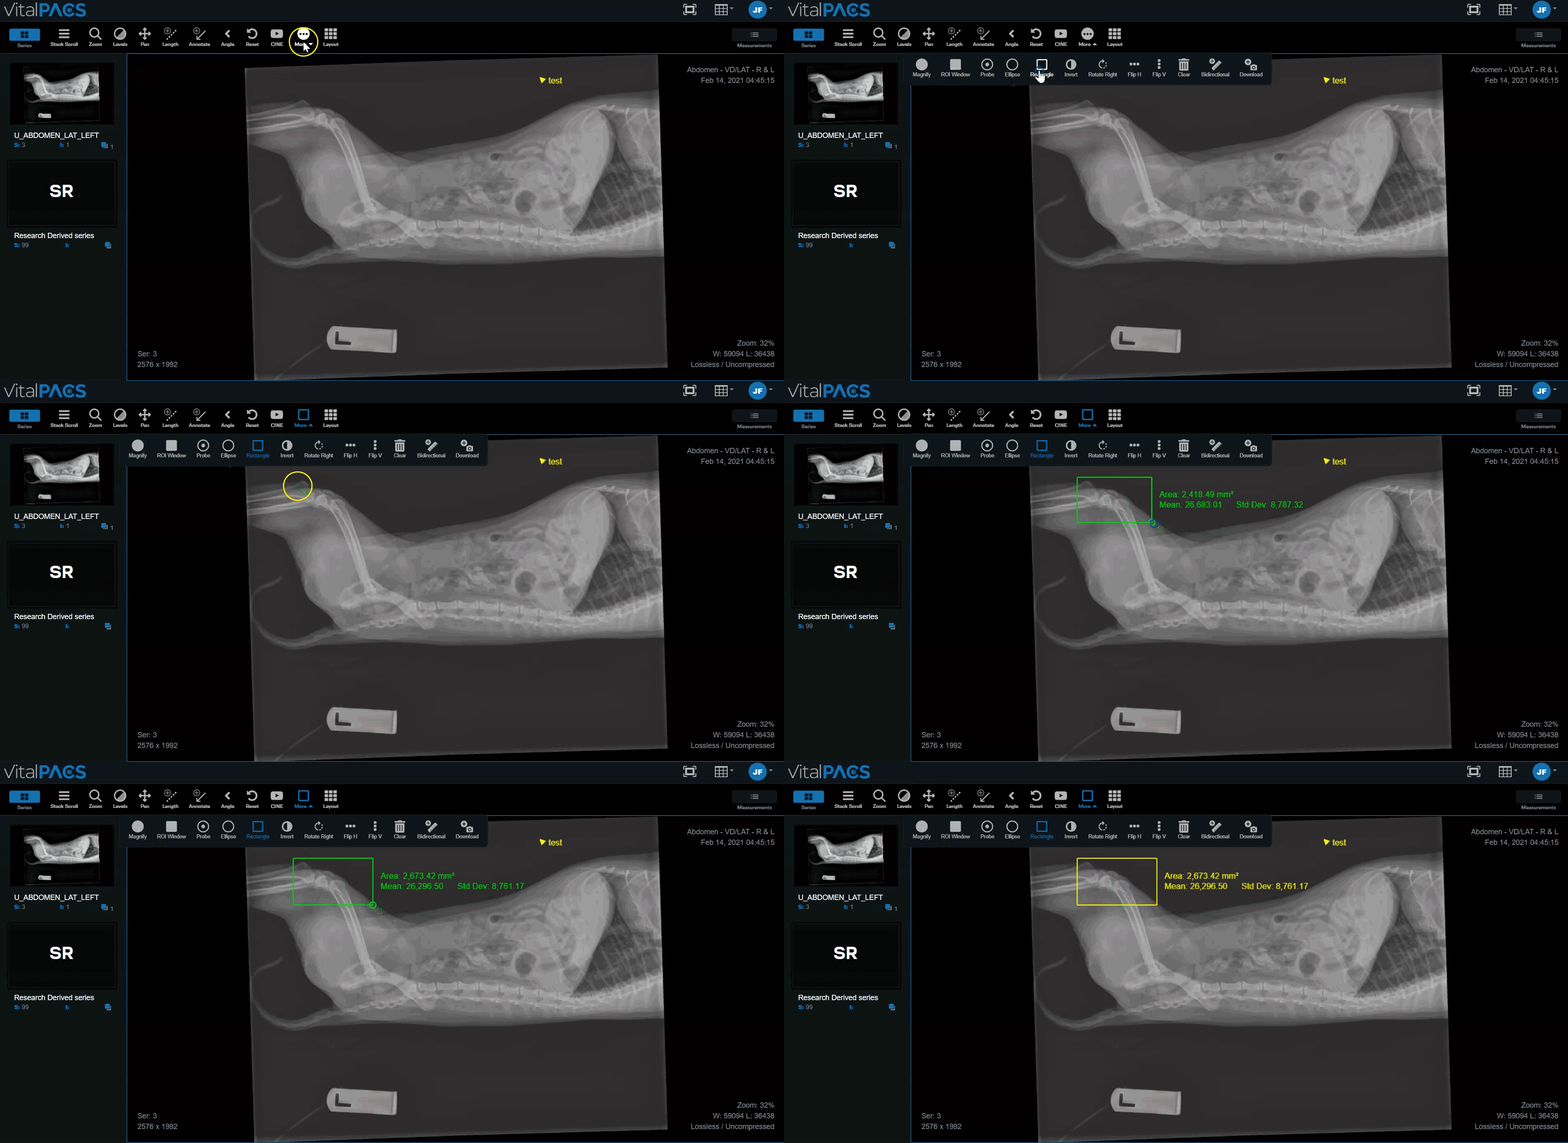
Rectangle
Select the More button from the Viewer toolbar and the Rectangle button.
With the left button depressed, draw a rectangle around the desired area. The Area, Mean, and Standard Deviation measurements will appear when the mouse button is released.
The measurement will show the Mean value. Apply a label through the Measurement panel.
See Measurements Stack for more information

